Web Performance Interview Questions: Core Web Vitals to Rendering (2026)
Prepare for web performance interview questions with Core Web Vitals, rendering, JavaScript cost, loading strategy, diagnostics, and model answers.
Web performance interview questions test whether you can connect a slow user experience to the browser work causing it. The best answers move from metric to likely cause, then to a measurement plan and a fix.
Do not prepare by memorizing one list of tricks. Practice explaining how loading, rendering, JavaScript, network priority, images, fonts, and user interactions affect the page.
Use current metric names. web.dev Web Vitals lists LCP, INP, and CLS as the current Core Web Vitals, with the 75th percentile target across mobile and desktop. web.dev Learn Performance and MDN critical rendering path are useful references for the browser pipeline behind those numbers.
What interviewers are testing
| Area | What to know | How to answer |
|---|---|---|
| LCP | Largest contentful element, TTFB, render-blocking CSS, image priority | Name the likely LCP element and the first measurement you would check |
| INP | Input delay, event handlers, long tasks, rendering after input | Separate lab TBT from field INP and explain main-thread work |
| CLS | Image dimensions, ads, late fonts, inserted content | Find the moving element and remove unstable layout |
| Rendering | HTML parsing, CSSOM, layout, paint, compositing | Connect a UI symptom to the browser stage that can cause it |
| JavaScript cost | Bundle size, hydration, parsing, execution, memory | Explain what code can be delayed, split, or moved off the critical path |
| Tooling | DevTools, Lighthouse, WebPageTest, CrUX, RUM | Choose the tool based on whether you need lab diagnosis or field impact |
Questions and model answers
1. What are Core Web Vitals in 2026?
The current Core Web Vitals are LCP for loading, INP for interactivity, and CLS for visual stability. Good thresholds are LCP at 2.5 seconds or less, INP at 200 milliseconds or less, and CLS at 0.1 or less. Assess the 75th percentile of page loads separately for mobile and desktop; a combined number can hide a slow device segment.
Good answer shape:
- Name all three metrics and what user experience each one represents.
- Give the current good thresholds.
- Say that INP replaced FID as the stable interactivity metric.
- Explain why field data is needed for final judgment.
Common mistake: Listing FID as the current Core Web Vital, forgetting the thresholds, or treating a single Lighthouse run as the whole performance story.
2. How would you debug a poor LCP score?
Start by finding the LCP element in field or lab tooling. If it is an image or hero text, check server response time, render-blocking CSS, image size, image priority, font loading, and whether client-side rendering delays the element.
Good answer shape:
- Identify the LCP element before changing code.
- Check TTFB, resource waterfall, CSS/JS blocking, and image priority.
- Propose one fix tied to the measured bottleneck.
Common mistake: Shrinking the JavaScript bundle before checking whether the LCP element is blocked by server latency or an unprioritized image.
3. Why can Lighthouse miss a real INP problem?
INP is based on real interactions. Lighthouse can use lab signals such as Total Blocking Time, but it cannot reproduce every user click, device, extension, background task, and data state. Use Lighthouse for early diagnosis and field data for final confidence.
Good answer shape:
- Separate lab proxy metrics from field interaction metrics.
- Name long tasks and expensive handlers as common causes.
- Explain how you would collect RUM or web-vitals data.
Common mistake: Saying the page is fine because Lighthouse is green while users still report delayed clicks.
4. What is the critical rendering path?
It is the work the browser must do before pixels appear: parse HTML, discover resources, build the DOM and CSSOM, run blocking scripts when needed, calculate layout, paint, and composite. The interview value is knowing which resources block which step.
Good answer shape:
- Describe the pipeline without turning it into jargon.
- Mention render-blocking CSS and parser-blocking scripts.
- Tie the explanation to a specific optimization.
Common mistake: Repeating the pipeline but not explaining how a stylesheet, script, or font changes the user experience.
5. How do you improve a slow interaction?
Measure the interaction first. Then reduce synchronous work in the handler, split large updates, avoid unnecessary rerenders, move expensive non-UI work to a worker when appropriate, and keep the visual response close to the input.
Good answer shape:
- Find the interaction and its long tasks.
- Reduce render and JavaScript work before adding more loading states.
- Verify with field data after shipping.
Common mistake: Adding debounce to every input without understanding whether the delay is network, rendering, or CPU work.
6. When should you use code splitting?
Use code splitting when code is not needed for the first meaningful task: route-level admin screens, heavy charts, editors, maps, or rarely used modals. Do not split tiny modules so aggressively that the page becomes a chain of extra requests.
Good answer shape:
- Name the user path that should get faster.
- Split by route, feature, or heavy dependency.
- Check network overhead and loading states.
Common mistake: Treating smaller initial JavaScript as automatically better when the app now stalls on many late chunks.
7. How do image choices affect performance?
Images affect bytes, decoding, layout stability, and LCP. A good answer covers dimensions, responsive srcset, modern formats, lazy loading below the fold, priority for the LCP image, and avoiding layout shifts.
Good answer shape:
- Separate hero images from below-the-fold images.
- Mention dimensions and responsive sources.
- Connect image priority to LCP.
Common mistake: Lazy-loading the hero image that is likely to become the LCP element.
8. How would you explain performance tradeoffs to a product team?
Translate the metric into user pain: slow first content, delayed tap response, or moving layout. Then propose a small fix with a measurable target and a product caveat, such as deferring a carousel or reducing a third-party script.
Good answer shape:
- Use user-facing language before technical details.
- Make a measurable recommendation.
- Name what product behavior changes, if anything.
Common mistake: Saying "performance is important" without identifying the user task or business tradeoff.
9. Which tools would you use to debug performance?
Use the tool that matches the question. Lighthouse is useful for a repeatable lab snapshot. Chrome DevTools Performance and Network panels help inspect traces, long tasks, waterfalls, layout shifts, and resource priority. WebPageTest is useful for network waterfalls, filmstrips, and device/location testing. CrUX and RUM show whether real users are affected.
Good answer shape:
- Start with field data when the question is about user impact.
- Use lab tools to reproduce and isolate the bottleneck.
- Name the signal each tool gives, not only the tool name.
Common mistake: Saying "I would run Lighthouse" for every problem, including interaction bugs that only happen for real users.
10. How do resource hints and script loading affect performance?
Resource hints change when the browser discovers or prioritizes work. preconnect can warm up a critical third-party origin, preload can fetch a critical resource earlier, and fetchpriority="high" gives the browser a priority hint for the likely LCP image. Classic scripts use defer when order matters and async when it does not; module scripts are deferred by default. Route-level loading can keep code for later interactions off the initial path.
Good answer shape:
- Identify the critical resource before adding hints.
- Explain discovery, priority, and ordering separately.
- Mention that overusing hints can compete with more important resources.
Common mistake: Preloading many files because it sounds faster, then making the real critical path noisier.
11. How do caching, CDN delivery, and compression help?
They reduce network cost, but they do not fix every performance problem. A CDN can reduce latency for static assets and cached HTML. HTTP caching can avoid repeat downloads. Compression reduces transfer size. These help loading metrics, but INP may still be poor if the page ships too much JavaScript or does expensive work after interaction.
Good answer shape:
- Separate first visit, repeat visit, and geography.
- Mention cache headers, immutable asset names, CDN edges, and compression.
- Say what caching cannot solve: main-thread work, layout instability, or bad interaction design.
Common mistake: Saying "put it on a CDN" without checking whether the bottleneck is network, server, rendering, or JavaScript execution.
12. How would you debug a React page that becomes slow after data loads?
Profile the interaction or update first. Look for a large rerender, expensive derived data, layout work, too many DOM nodes, heavy third-party components, or hydration cost. Then reduce the render scope, move expensive computation out of the urgent path, virtualize long lists when DOM size is the problem, and use memoization only when the profile shows repeated work.
Good answer shape:
- Capture the slow interaction or update in a profiler.
- Separate data size, render scope, DOM size, and main-thread work.
- Choose a fix that preserves accessibility and loading states.
Common mistake: Adding memo, useMemo, or useCallback everywhere before proving rerenders are the bottleneck.
How to practice
Practice performance answers as diagnosis drills. Start with one symptom, ask what you would measure, then name a fix only after the likely cause is clear.
- Open a slow page, identify its LCP element, and write three possible causes before changing code.
- Profile a delayed click and separate input delay, handler cost, render cost, and paint cost.
- Explain why a page can pass lab checks but still fail for users on lower-end devices.
- Practice Data Table with sorting and pagination, then discuss rendering cost.
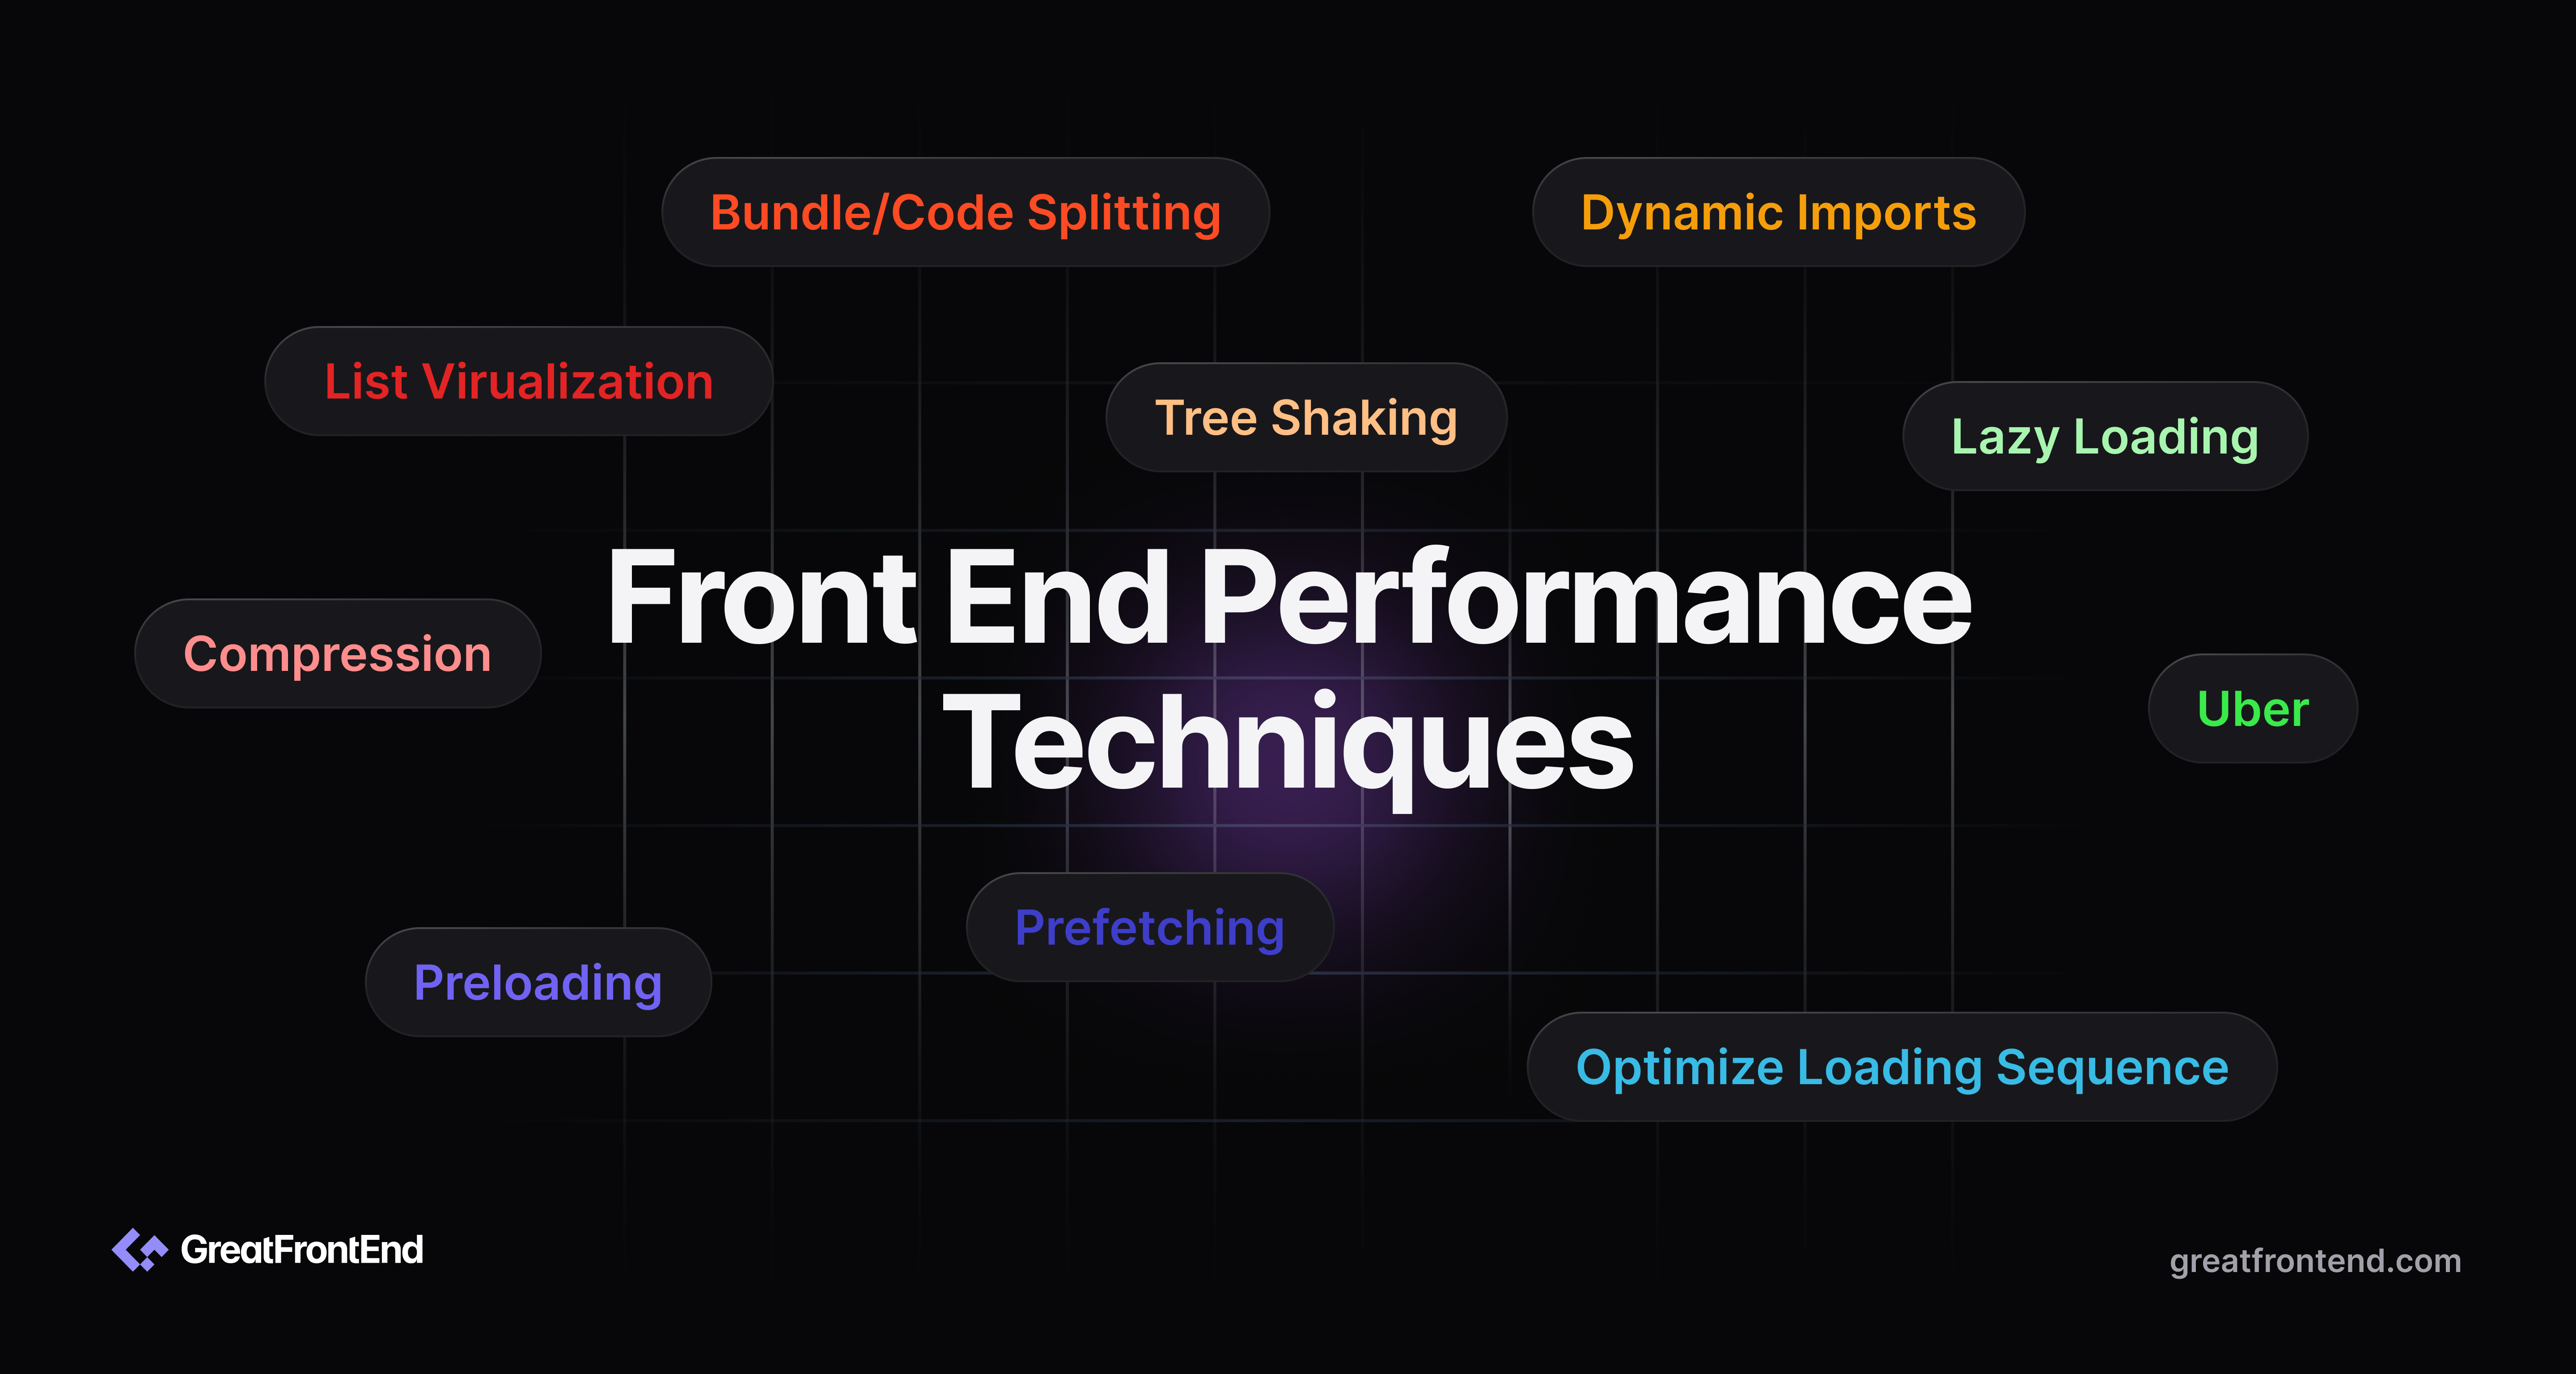
- Review Front End Performance Techniques for a broader optimization checklist.
Extended question bank
Answer these aloud as diagnosis exercises. Name the affected metric or user-visible delay, the trace or field signal you would inspect, and how you would verify the change after release.
1. How would you debug poor LCP on a product page?
Start by identifying the LCP element in field data or a trace. Then separate causes: slow TTFB, render-blocking CSS, late image discovery, missing image dimensions, slow image bytes, font blocking, client-side rendering delay, or long main-thread work. A good answer includes the fix order: measure first, improve the biggest bottleneck, ship one change, and compare field data after release.
2. Why can a small JavaScript bundle still have poor INP?
Bundle size is only one input. INP can be hurt by expensive event handlers, synchronous validation, layout thrashing, rendering too many nodes, heavy third-party code, or state updates that cause a large subtree to rerender. Explain how you would capture a performance trace, find long tasks around the interaction, and move or split work without breaking the interaction.
3. How do you prevent layout shift in a feed?
Reserve dimensions for images, ads, embeds, and recommendation modules before they load. Avoid inserting content above the current viewport, avoid late font swaps that move text, and keep skeleton dimensions close to final dimensions. Mention CLS verification because visual stability problems are often introduced by asynchronous content.
4. When is code splitting harmful?
Code splitting helps when it removes non-critical code from the first path. It hurts when critical UI waits for too many chunks, when shared dependencies are duplicated, or when route transitions show blank states because loading boundaries were not designed. A senior answer discusses both network waterfall and user experience.
5. How should performance work be prioritized?
Prioritize user-visible paths and measured bottlenecks. For example, improve LCP on landing/product pages, INP on search/forms/editors, and CLS on content feeds. Avoid optimizing everything equally. Tie each task to a metric, affected route, expected impact, risk, and verification method.
Answer depth by level
Interviewers do not expect the same answer from every level. Use this table to calibrate how much depth to add.
| Level | What the answer should show |
|---|---|
| Fresher | Knows the current metrics, can explain loading versus interaction versus layout shift, and can use DevTools or Lighthouse to start debugging |
| Mid-level | Can identify the likely bottleneck, use traces and field data, fix images/scripts/rendering issues, and explain the tradeoff of one optimization |
| Senior | Can prioritize across routes, coordinate backend/frontend ownership, set budgets, instrument RUM, and prevent regressions through release process |
| Staff/lead | Can connect performance to product strategy, architecture, third-party governance, design-system defaults, and observability across teams |
Advanced follow-up answers
How do you explain LCP parts?
LCP can be split into server response time, resource load delay, resource load duration, and element render delay. That split prevents vague answers. If the image bytes are small but the browser discovers the image late, compressing it again will not fix the main issue. If the element is ready but render is delayed by hydration or CSS, prioritize the render path instead of the asset.
What is the difference between TBT and INP?
Total Blocking Time is a lab metric that estimates main-thread blocking between FCP and Time to Interactive. INP is a field metric based on real interactions and the next paint after those interactions. TBT can help during debugging, but a good answer says field INP is the user-impact metric.
How can CSS hurt performance?
CSS can block rendering, trigger layout work, create expensive selectors in very large documents, cause layout shifts when late styles arrive, and animate properties that require layout or paint. The practical answer is not "write less CSS"; it is "ship critical CSS carefully, avoid unstable layout, and animate compositor-friendly properties when possible."
How can hydration hurt performance?
Hydration can delay interactivity when the browser must download, parse, execute, and attach event handlers before a UI behaves correctly. A strong answer mentions partial hydration, islands, server components, progressive enhancement, or reducing client-only work, but only after explaining the actual bottleneck.
How do you make a performance budget useful?
Tie budgets to routes and user tasks. A useful budget might track LCP image size, JavaScript bytes for the initial route, long tasks during key interactions, CLS from dynamic modules, and third-party script cost. Budgets should have owners and exceptions; otherwise they become ignored dashboards.
How do you debug a slow third-party script?
Measure its network cost, main-thread cost, and route coverage. Then ask whether it can load after consent, after interaction, on fewer routes, or through a lighter integration. If the business needs the script, isolate it, monitor regressions, and make the owner explicit.
How do you explain virtualization tradeoffs?
Virtualization helps when the DOM size makes rendering or interaction slow. It adds complexity around keyboard navigation, screen-reader behavior, dynamic heights, scroll restoration, and testing. A good answer says to profile first and keep accessibility behavior intact.
How do you verify a performance fix after release?
Use the same segment that showed the problem: route, device class, geography, network, and release window. Compare field data after enough traffic has passed, watch error and conversion metrics, and keep a rollback path if the fix changes loading order or user-visible behavior.
Worked example: debugging a slow product page
Imagine an interviewer says a product detail page feels slow on mobile. A shallow answer jumps straight to "compress images" or "use lazy loading." A better answer asks what users experience and which metric is failing. If the page is slow before the main product image appears, start with LCP. If the page appears but taps lag, start with INP. If content jumps as reviews or recommendations load, start with CLS.
Use this sequence:
- Identify the route, device segment, and metric in field data if available.
- Open a trace and find the LCP element, render-blocking resources, long tasks, and third-party work.
- Check whether the hero image is discoverable early, correctly sized, compressed, and prioritized.
- Check whether hydration or client-side rendering delays the meaningful content.
- Ship one change at a time so the result can be attributed.
The final answer should sound like an investigation plan. For example: "I would first confirm whether LCP or INP is the problem. If LCP is poor and the LCP element is the hero image, I would check discovery, priority, dimensions, and bytes. If those are fine, I would look at TTFB and render-blocking resources. I would verify locally with a trace and later with field data." That answer gives the interviewer a real debugging path.
Avoid listing every performance trick. Interviewers are looking for sequencing and diagnosis. The best answer is usually smaller and more precise than a long checklist.
A good web performance interview answer is not a bag of tricks. It is a measured path from user symptom to browser cause to fix.
Related articles
 Learn how to implement Code Splitting and Lazy Loading in React and it's importance.
 Explore powerful techniques for handling large datasets in React application, including pagination, infinite scroll, and windowing